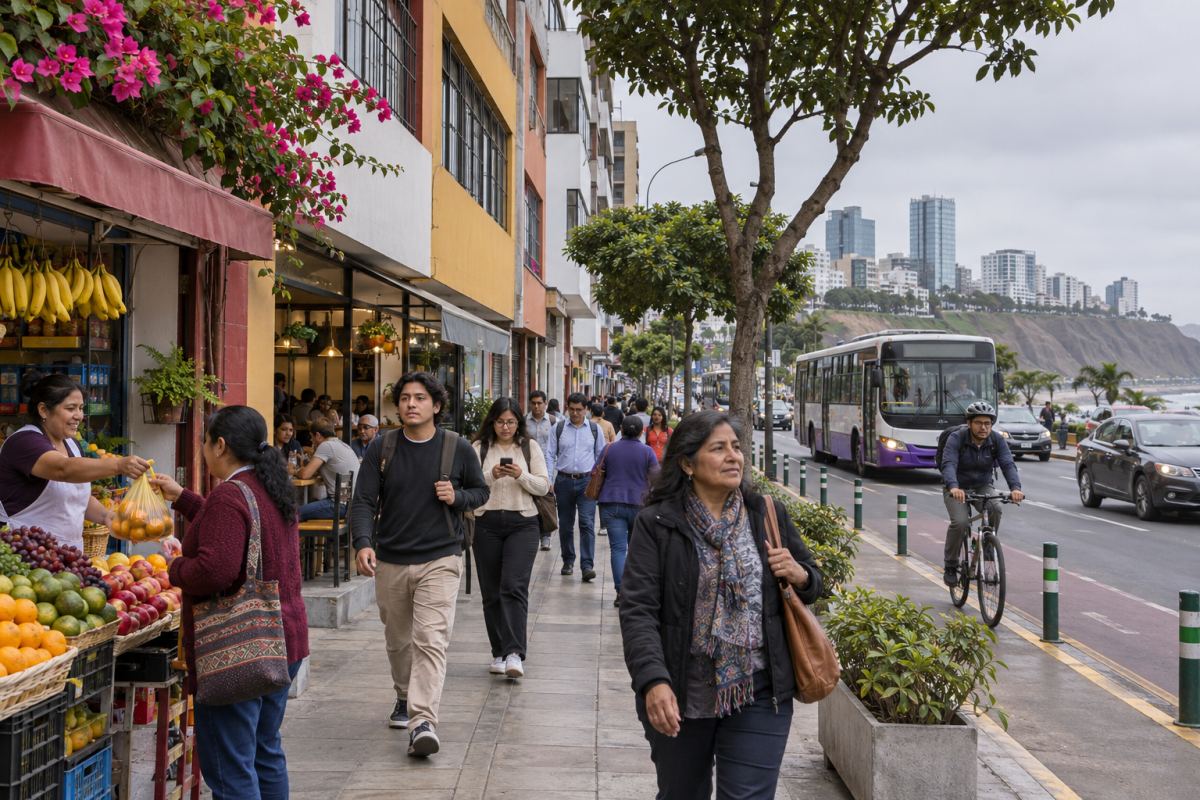

Peru’s economy grew by 3.4% in 2025 and the monetary poverty rate fell from 27.6% to 25.7%, according to official figures released in 2026. But there is another way to look at the country: asking whether people can live safely, access quality services and exercise their rights on equal terms.
From that perspective, Peru scores 67.41 out of 100 and ranks 82nd among 171 countries in the Social Progress Index’s 2025 series. That does not contradict economic growth, nor is it an alternative poverty measure. The index brings together social and environmental indicators from different sources and years, without directly incorporating income into its calculation.
The Índice de Progreso Social Mundial 2026, published in January by Centrum PUCP, the business school of the Pontifical Catholic University of Peru, analyzes results from the index developed by Social Progress Imperative. The report is authored by Rubén Guevara Moncada, Beatrice Elcira Avolio Alecchi, Luis Alfonso Del Carpio Castro and José Calsina Gutierrez.
It raises a question that runs through Peru’s public debate: To what extent do expanding services and economic activity translate into living conditions and opportunities shared across society? The index cannot establish cause and effect, but it can point to areas where national averages conceal persistent difficulties.
Three ways to measure well-being
The index organizes its findings into three dimensions. On basic human needs, which includes nutrition, basic medical care, water and sanitation, shelter, and personal safety, Peru scores 76.60 points and ranks 101st. On foundations of well-being it scores 68.90 and ranks 71st. On opportunity it scores 56.73 and ranks 75th.
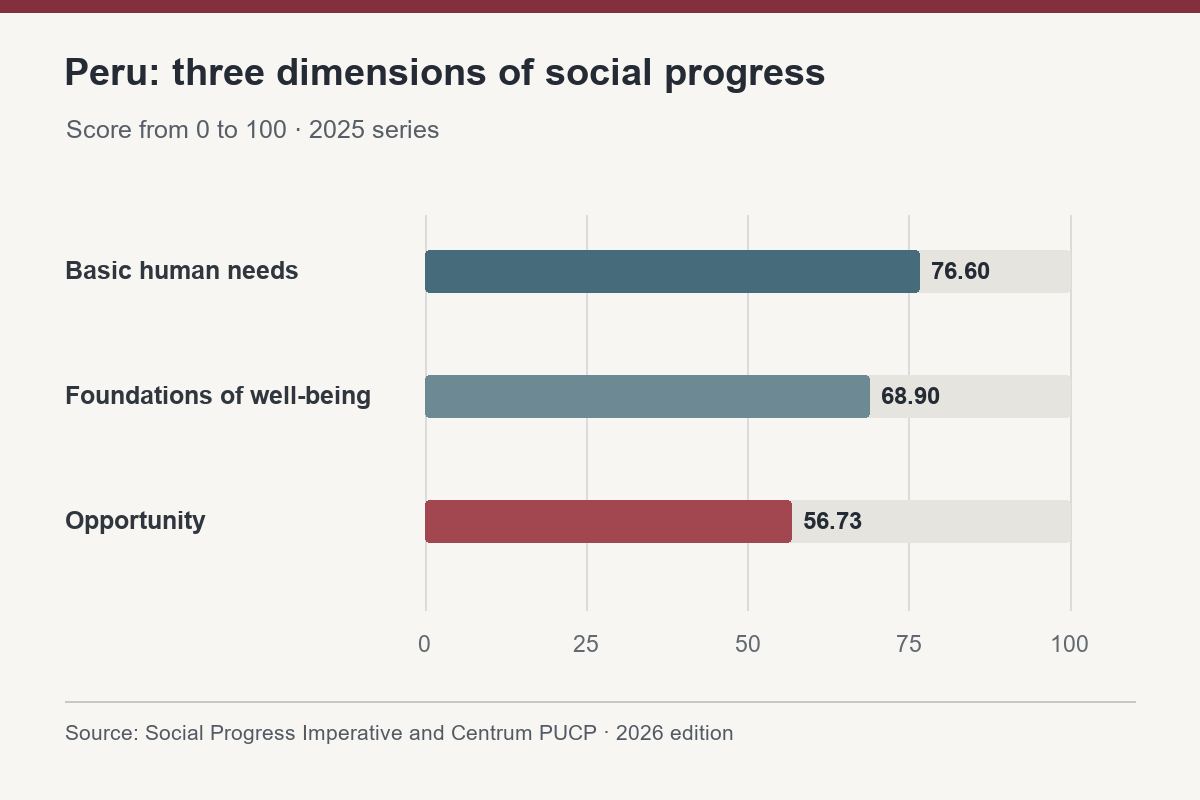
The first dimension looks at conditions essential to life; the second includes basic education, health and access to information, among other areas; the third considers rights, freedoms, inclusion and access to higher education. Their scores are not percentages of people served. They are composite measures on a zero-to-100 scale, built from different variables.
The differences show that social progress has several dimensions. A country can have a higher overall score for basic needs than for opportunity while ranking lower internationally on the former. Its position also depends on other countries’ performance, not just its own score.
Nor is the index a photograph taken on the last day of 2025. The edition brings together the most recent information available for each indicator, and the years and sources can vary. Its results are best read as a composite assessment, not a simultaneous census of every aspect of living conditions.
Access to school does not always mean equal education
Education illustrates why coverage and equality need to be examined separately. In access to basic knowledge, Peru scores 69.13 and ranks 100th. Within that component, its primary school enrollment indicator reaches a normalized score of 99.59 and ranks 18th, while equal access to quality education scores 28 and ranks 127th.
Those values do not mean that 99.59% of children are enrolled or that 28% receive an equal education. The index transforms data to construct its scales. Nor do the indicators measure the same question: one looks at enrollment, the other at equality in access to quality education.
The comparison nevertheless raises a concrete question for public policy. Opening the school door is essential; making sure students have access to quality educational opportunities regardless of their circumstances requires looking beyond enrollment.
National figures alone cannot identify where every disadvantage lies. Mapping those gaps requires data by area and population group, as well as information about actual teaching conditions. A favorable national enrollment score does not settle those questions.
Health presents a similar tension. In health and wellness, Peru ranks 55th, with 63.69 points. Yet the indicator for equal access to quality healthcare places it 120th, with a normalized score of 32.45. A broad component and one of its specific indicators are not directly interchangeable, but their differing ranks caution against assuming an adequate aggregate result guarantees equitable access.
Safety, rights and everyday life
Peru ranks 129th for personal safety, with 64.28 points. The component combines different areas, including traffic accidents, interpersonal violence and experiences or perceptions related to safety. It is not a single crime rate.
One indicator records how people feel about walking alone at night where they live. Peru ranks 131st and receives a normalized score of 36.36. This should not be read as the percentage of Peruvians who feel safe: it is a transformed score based on the measure used by the index.
Safety affects daily life in ways a single economic figure cannot capture. It can shape how people use public spaces and decide where to travel. The index identifies a relative weakness in this area; on its own, it cannot establish which specific policy would solve it or attribute it to a single cause.
The opportunity dimension adds questions about the rules that allow people to take part in society. Peru scores 55.98 and ranks 92nd for personal rights; 66.55 and 109th for personal freedom and choice; and 52.93 and 90th for inclusiveness. For access to advanced education, it scores 51.46 and ranks 56th.
These components group different indicators and should not be mistaken for percentages of people exercising a right or attending university. Their value is in prompting a look beyond the formal existence of services: rights, freedom to choose and inclusion are also part of the living conditions the index seeks to measure.
Inequality through the lens of household spending
Figures from Peru’s National Institute of Statistics and Informatics provide another piece of the picture. Monetary poverty fell in 2025 but affected 35.5% of the rural population, compared with 23.4% of the urban population. These are percentages of people below the monetary poverty line, not Social Progress Index scores.
Monetary poverty is measured by comparing household spending with the cost of a basic basket of goods and services. The rural-urban difference gives that issue a geographic dimension, although it does not by itself show where every gap in education, health or safety is concentrated. That would require disaggregated data and specific studies. Nor does it mean all rural communities or all urban households share the same circumstances.
INEI estimated monetary poverty in 2025 at 41.0% in Cajamarca and 40.1% in Loreto. Nationally, the 2025 rate of 25.7% remained above the 20.2% recorded in 2019, before the pandemic, according to the institute’s series. The decline from 2024 therefore coexists with ground still to be recovered against that earlier benchmark.
Another INEI finding sheds light on access to food: in 2025, 30.5% of the population experienced food insecurity, with prevalence at 35.4% in rural areas and 29.3% in urban areas. This is a different measure from monetary poverty; the two figures cannot be added together as though their populations did not overlap.
The official growth and poverty figures were released after Centrum PUCP published its report. They can be read alongside the index, provided their methods are kept distinct: an expanding economy and lower monetary poverty describe meaningful advances, while social indicators allow other dimensions of well-being to be examined.
Taken together, the figures also prevent any one variable from becoming a complete diagnosis. Falling poverty does not automatically demonstrate greater equality in the quality of healthcare; a weakness in safety does not demonstrate that economic growth has produced no benefits. The questions are connected, but distinct.
A regional comparison and a note on the data
In the same index series, Chile scores 79.50 and ranks 36th; Colombia scores 69.93 and ranks 67th; Mexico scores 68.70 and ranks 75th. Peru, at 67.41 and 82nd, is 12.09 points behind Chile. The comparison puts Peru in regional context, although it does not explain the reasons for each result or identify policies that could be transferred from one country to another.
The report also contains a discrepancy worth noting. One table gives Peru 53.73 points for opportunity, while the report’s own analysis and the index results reproduced by EY agree on 56.73. The report’s references to the change in ranking from the previous year also differ, so that change cannot be established with confidence from the document.
The exercise is no substitute for an evaluation of public policy and cannot attribute a trend to a particular government. Nor does it measure every individual experience. It does, however, offer an agenda of verifiable questions: which services reach each area, what quality they provide, who faces obstacles and how outcomes are measured over time.
For Peru, the central message is that coverage, safety and equal opportunity each need to be monitored in their own right. Growth can provide resources, and lower monetary poverty can ease deprivation. Turning those advances into more equitable conditions also requires a close look at the institutions and services that shape daily life.